
MS Excel
MS Excel is a spreadsheet software that is used to store, organise and analyse data in a structured form. Whether it is managing marks of students or preparing a monthly budget, maintaining attendance records or analysing the results of surveys, Excel helps in managing the data quickly and precisely.
In Class 7, students start to learn important features of MS Excel other than simple data entry. They learn how to format data, use formulas, sort and filter information, and even automate repeated tasks.
Let us understand these concepts in detail.
Understanding the Excel Window
When you open MS Excel, you see a structured working area called a worksheet.
An Excel file is called a workbook, and each workbook has 1 or more worksheets in it.
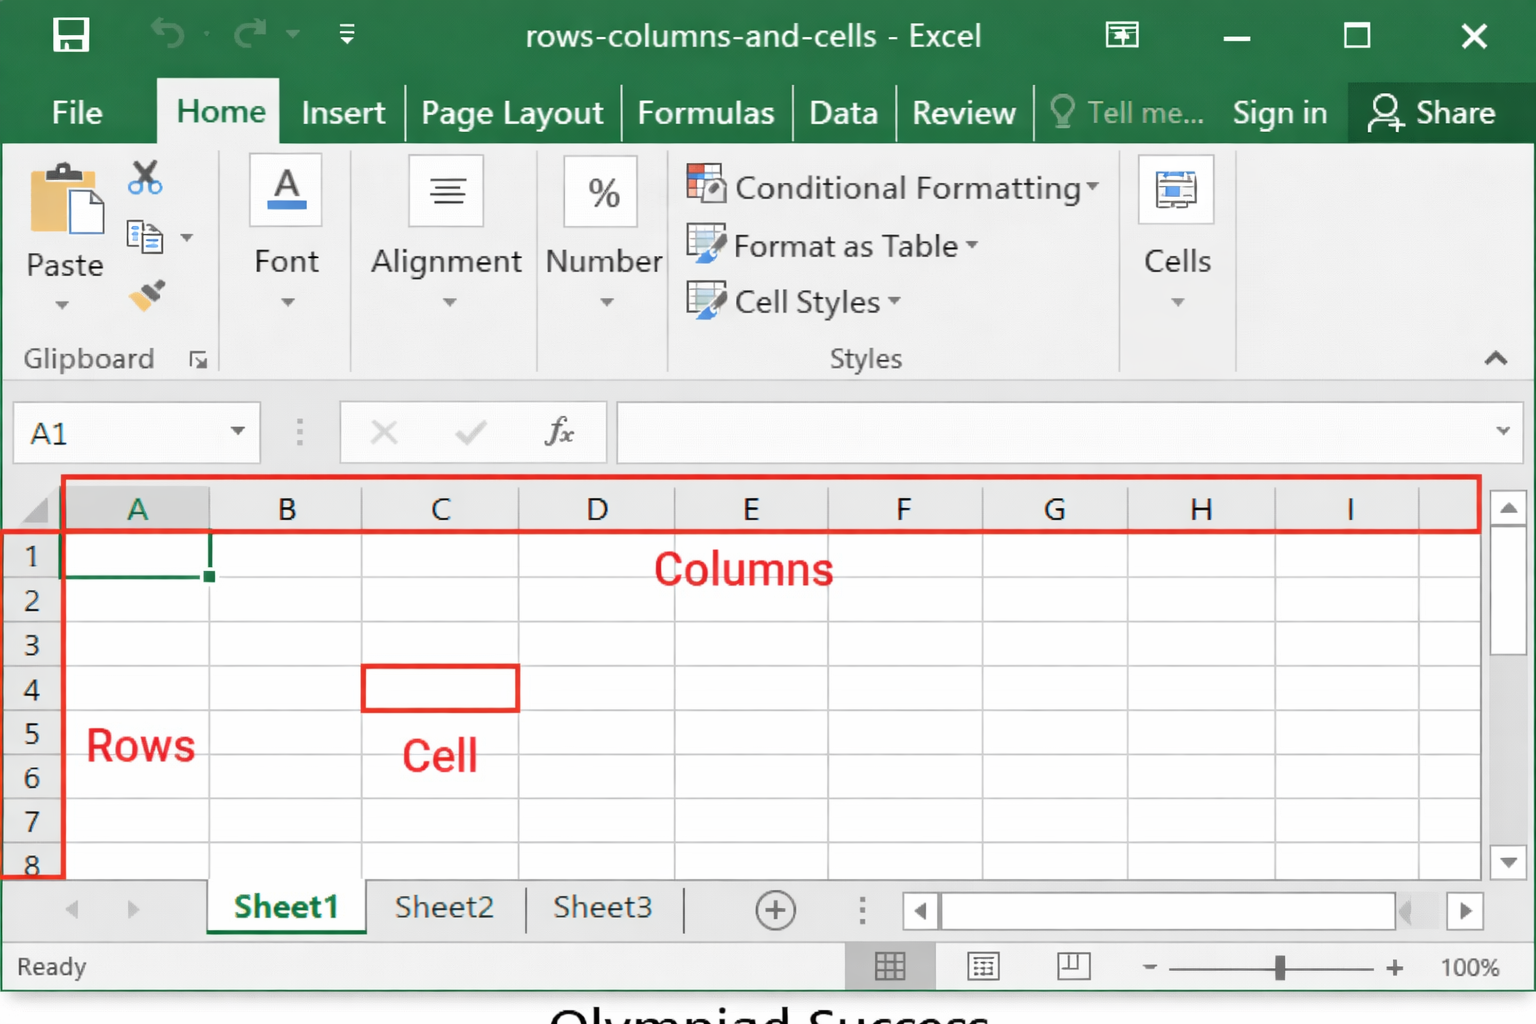
An Excel sheet is made up of:
- Rows – horizontal lines numbered 1, 2, 3...
- Columns – vertical lines labelled 'A', 'B', 'C'...
- Cells – small boxes that are created at the intersection of rows and columns
Each cell has a specific address.
For example:
- 'A1' means Column A and Row 1
- 'C5' means Column C and Row 5
Data such as text, numbers and formulas are entered in these cells.
Main Components in the MS Excel Window
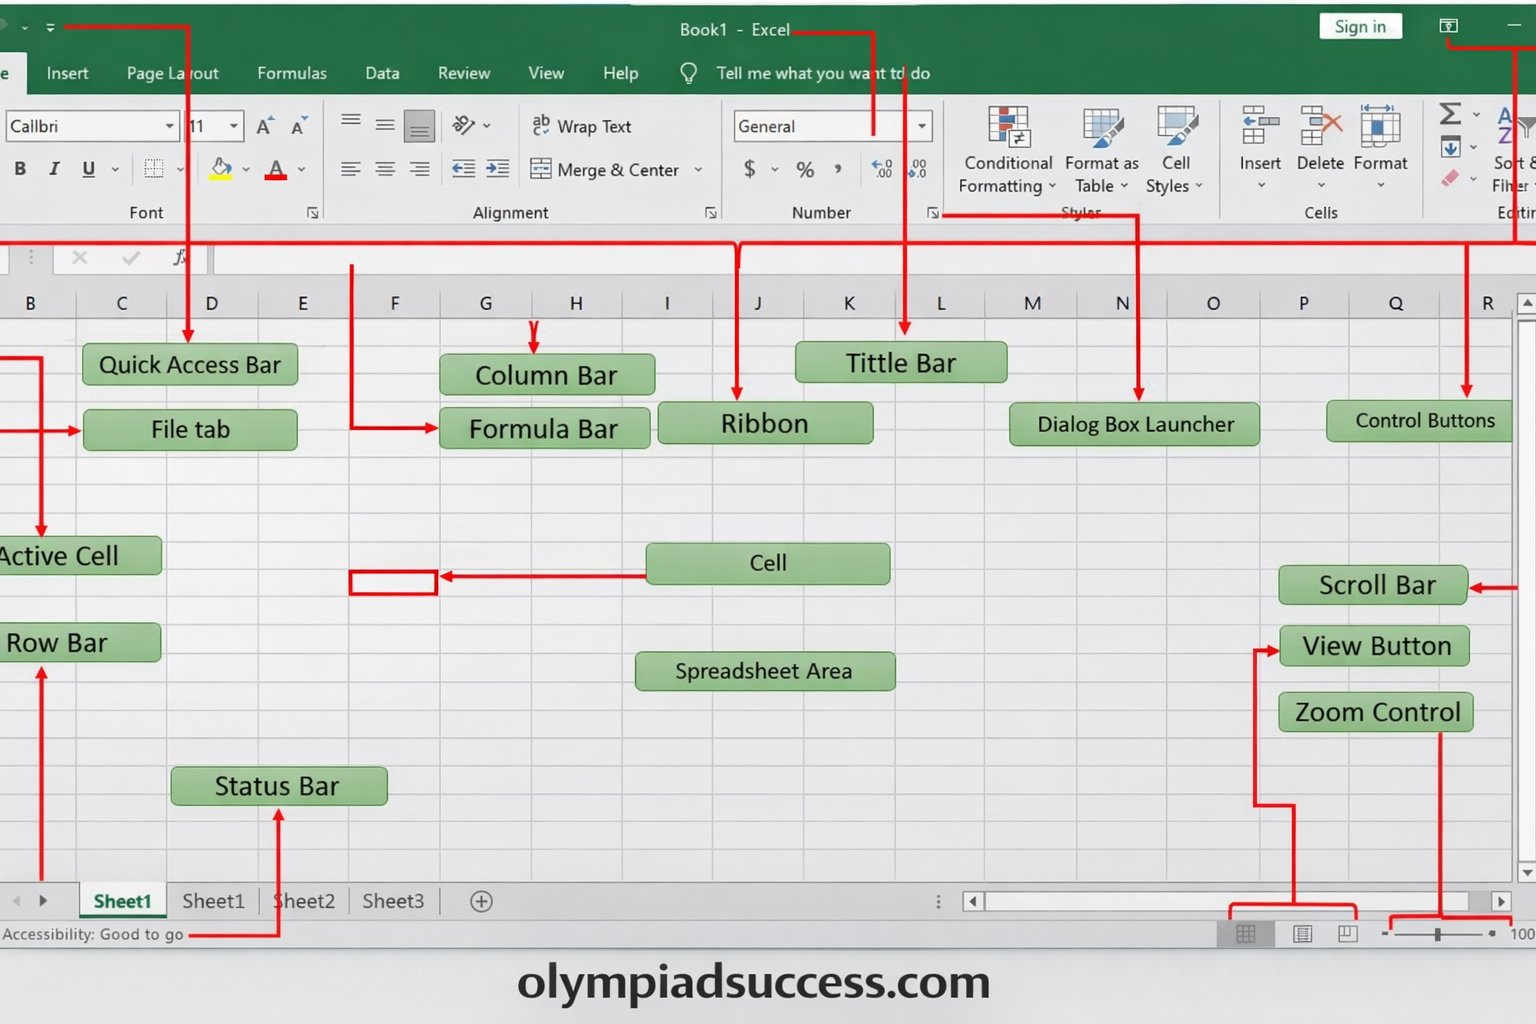
Title Bar
Displays the name of the workbook.
Quick Access Toolbar
Contains commonly used commands such as Save, Undo and Redo.
Ribbon
There are tabs on the ribbon, such as the following:
- Home
- Insert
- Page Layout
- Formulas
- Data
- View
Groups of related tools are defined in each tab.
Name Box
Displays the location of the currently selected cell.
Formula Bar
Displays the content of the active cell and can be edited.
Understanding such components helps students to navigate Excel with confidence.
Editing and Formatting Cells
The entry of data is just the first step. Presenting it in a clear way is just as important.
Editing Data
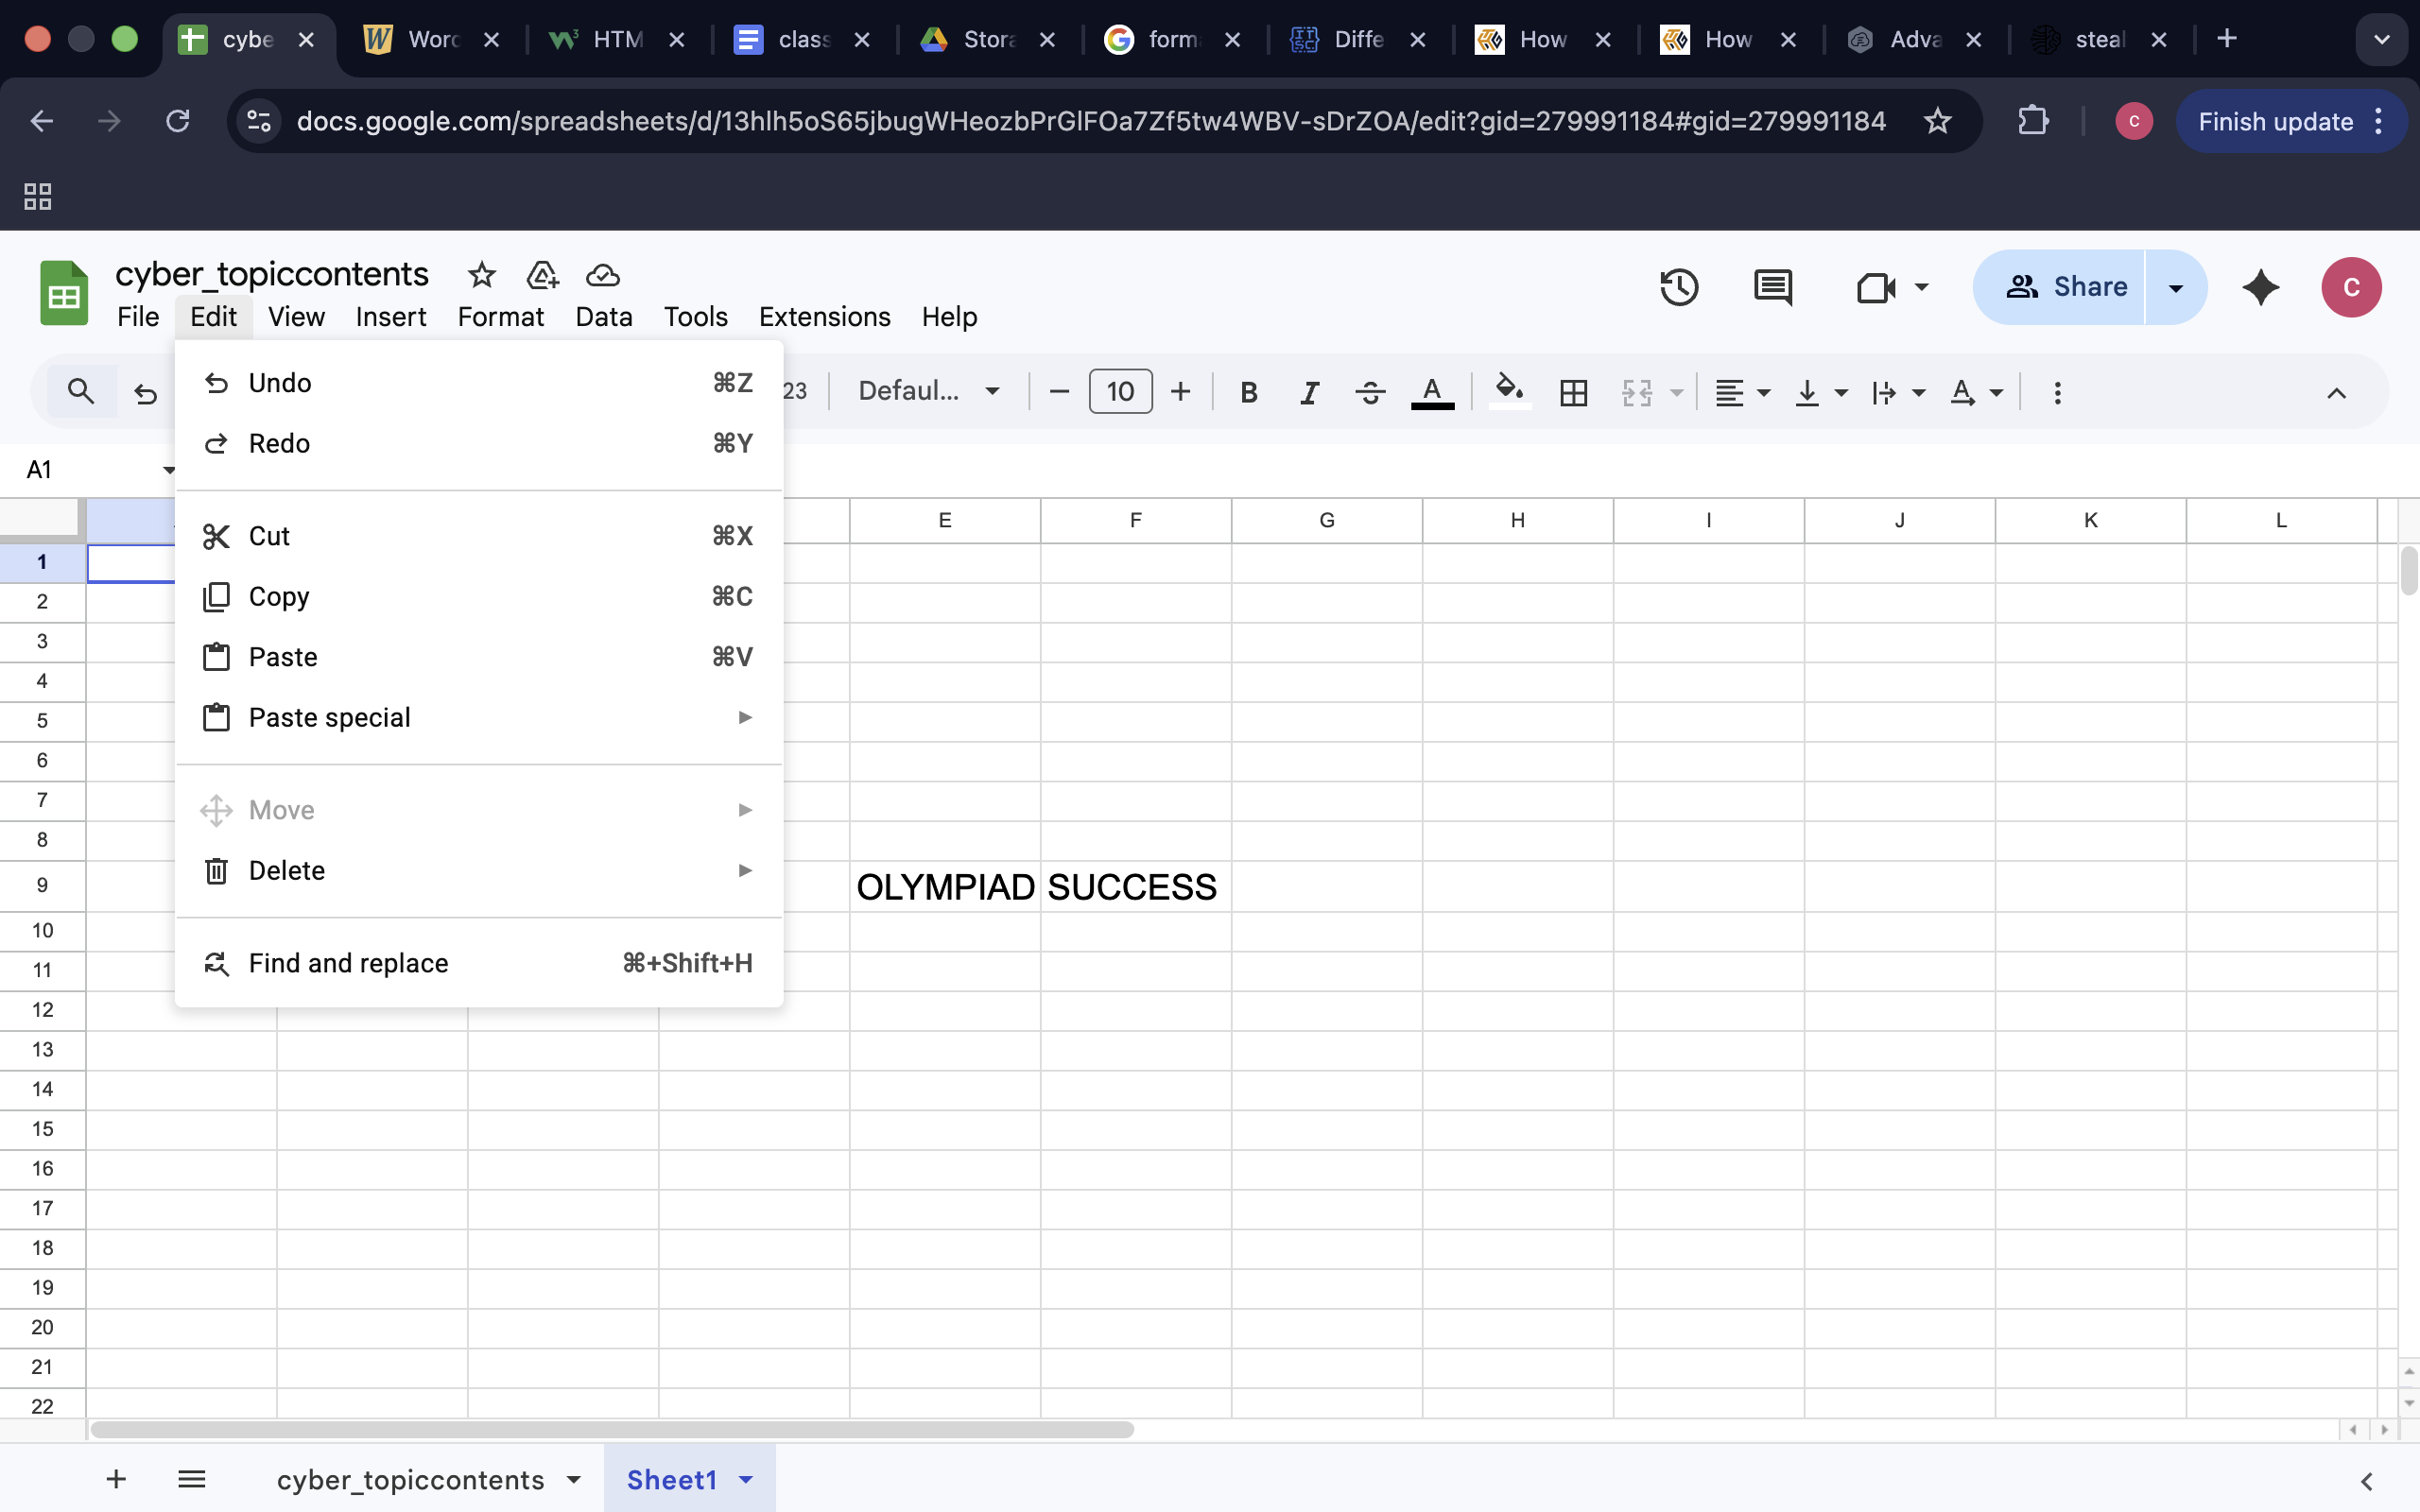
Students can:
- Correct mistakes
- Change numbers
- Insert new rows and columns
- Delete unnecessary data
- Copy and move data
- Editing ensures accuracy
Formatting Cells
Formatting makes it more readable & better presented.
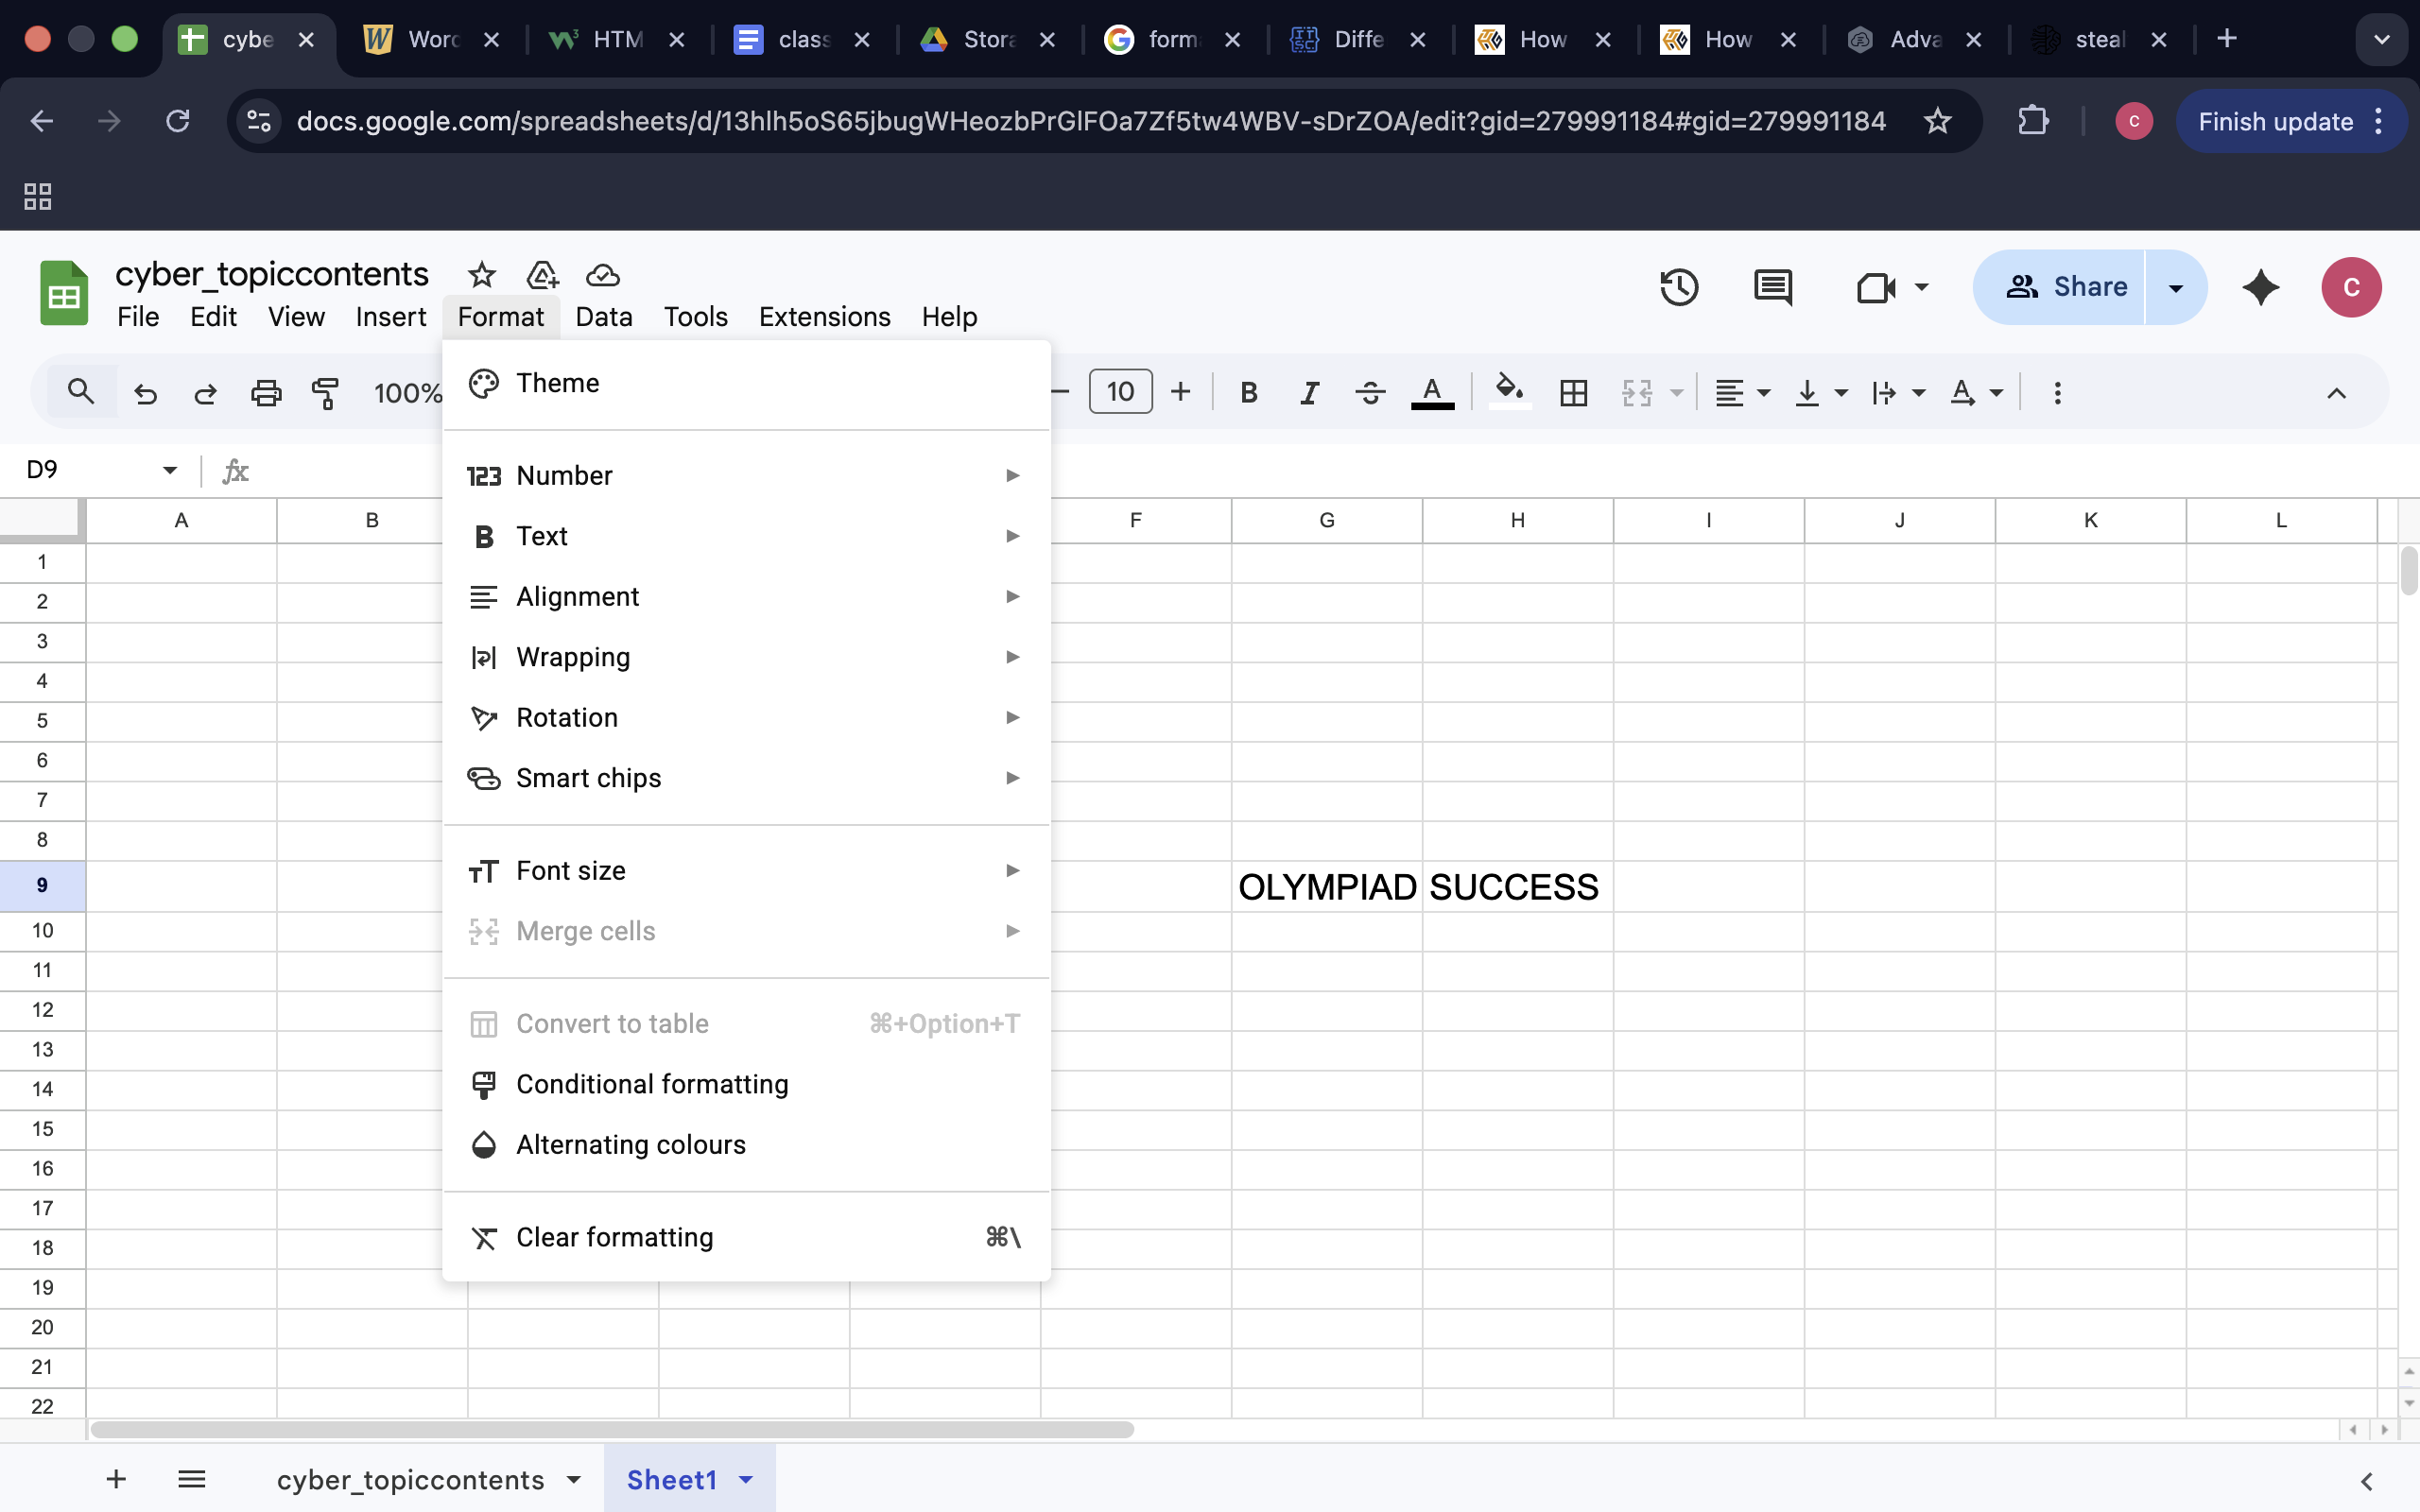
You can:
- Change font style and size
- Apply bold, italics or underlining.
- Change text colour
- Add cell borders
- Apply background colours
- Change alignment (left, centre, right)
For example, headings can be bold and highlighted so that the worksheet is organised.
Well-formatted worksheets are easier to read and understand.
Introduction to Formulas
One of the most powerful features of Excel is automatic calculations.
A formula is a mathematical expression that is used to calculate values in cells.
All formulas start with an equals sign (=).
For example:
= A1 + A2
This sums up the numbers in the cells A1 and A2.
Common Formulas
SUM
=SUM(A1:A5)
Adds values from A1 to A5.
AVERAGE
=AVERAGE(A1:A5)
Calculates the mean of selected values.
MIN
=MIN(A1:A5)
Finds the smallest value.
MAX
=MAX(A1:A5)
Finds the largest value.
Formulas make it less likely that an error will be made in calculations, and it saves time.
Sorting and Filtering Data
When data becomes large, it requires organisation to be able to analyse it.
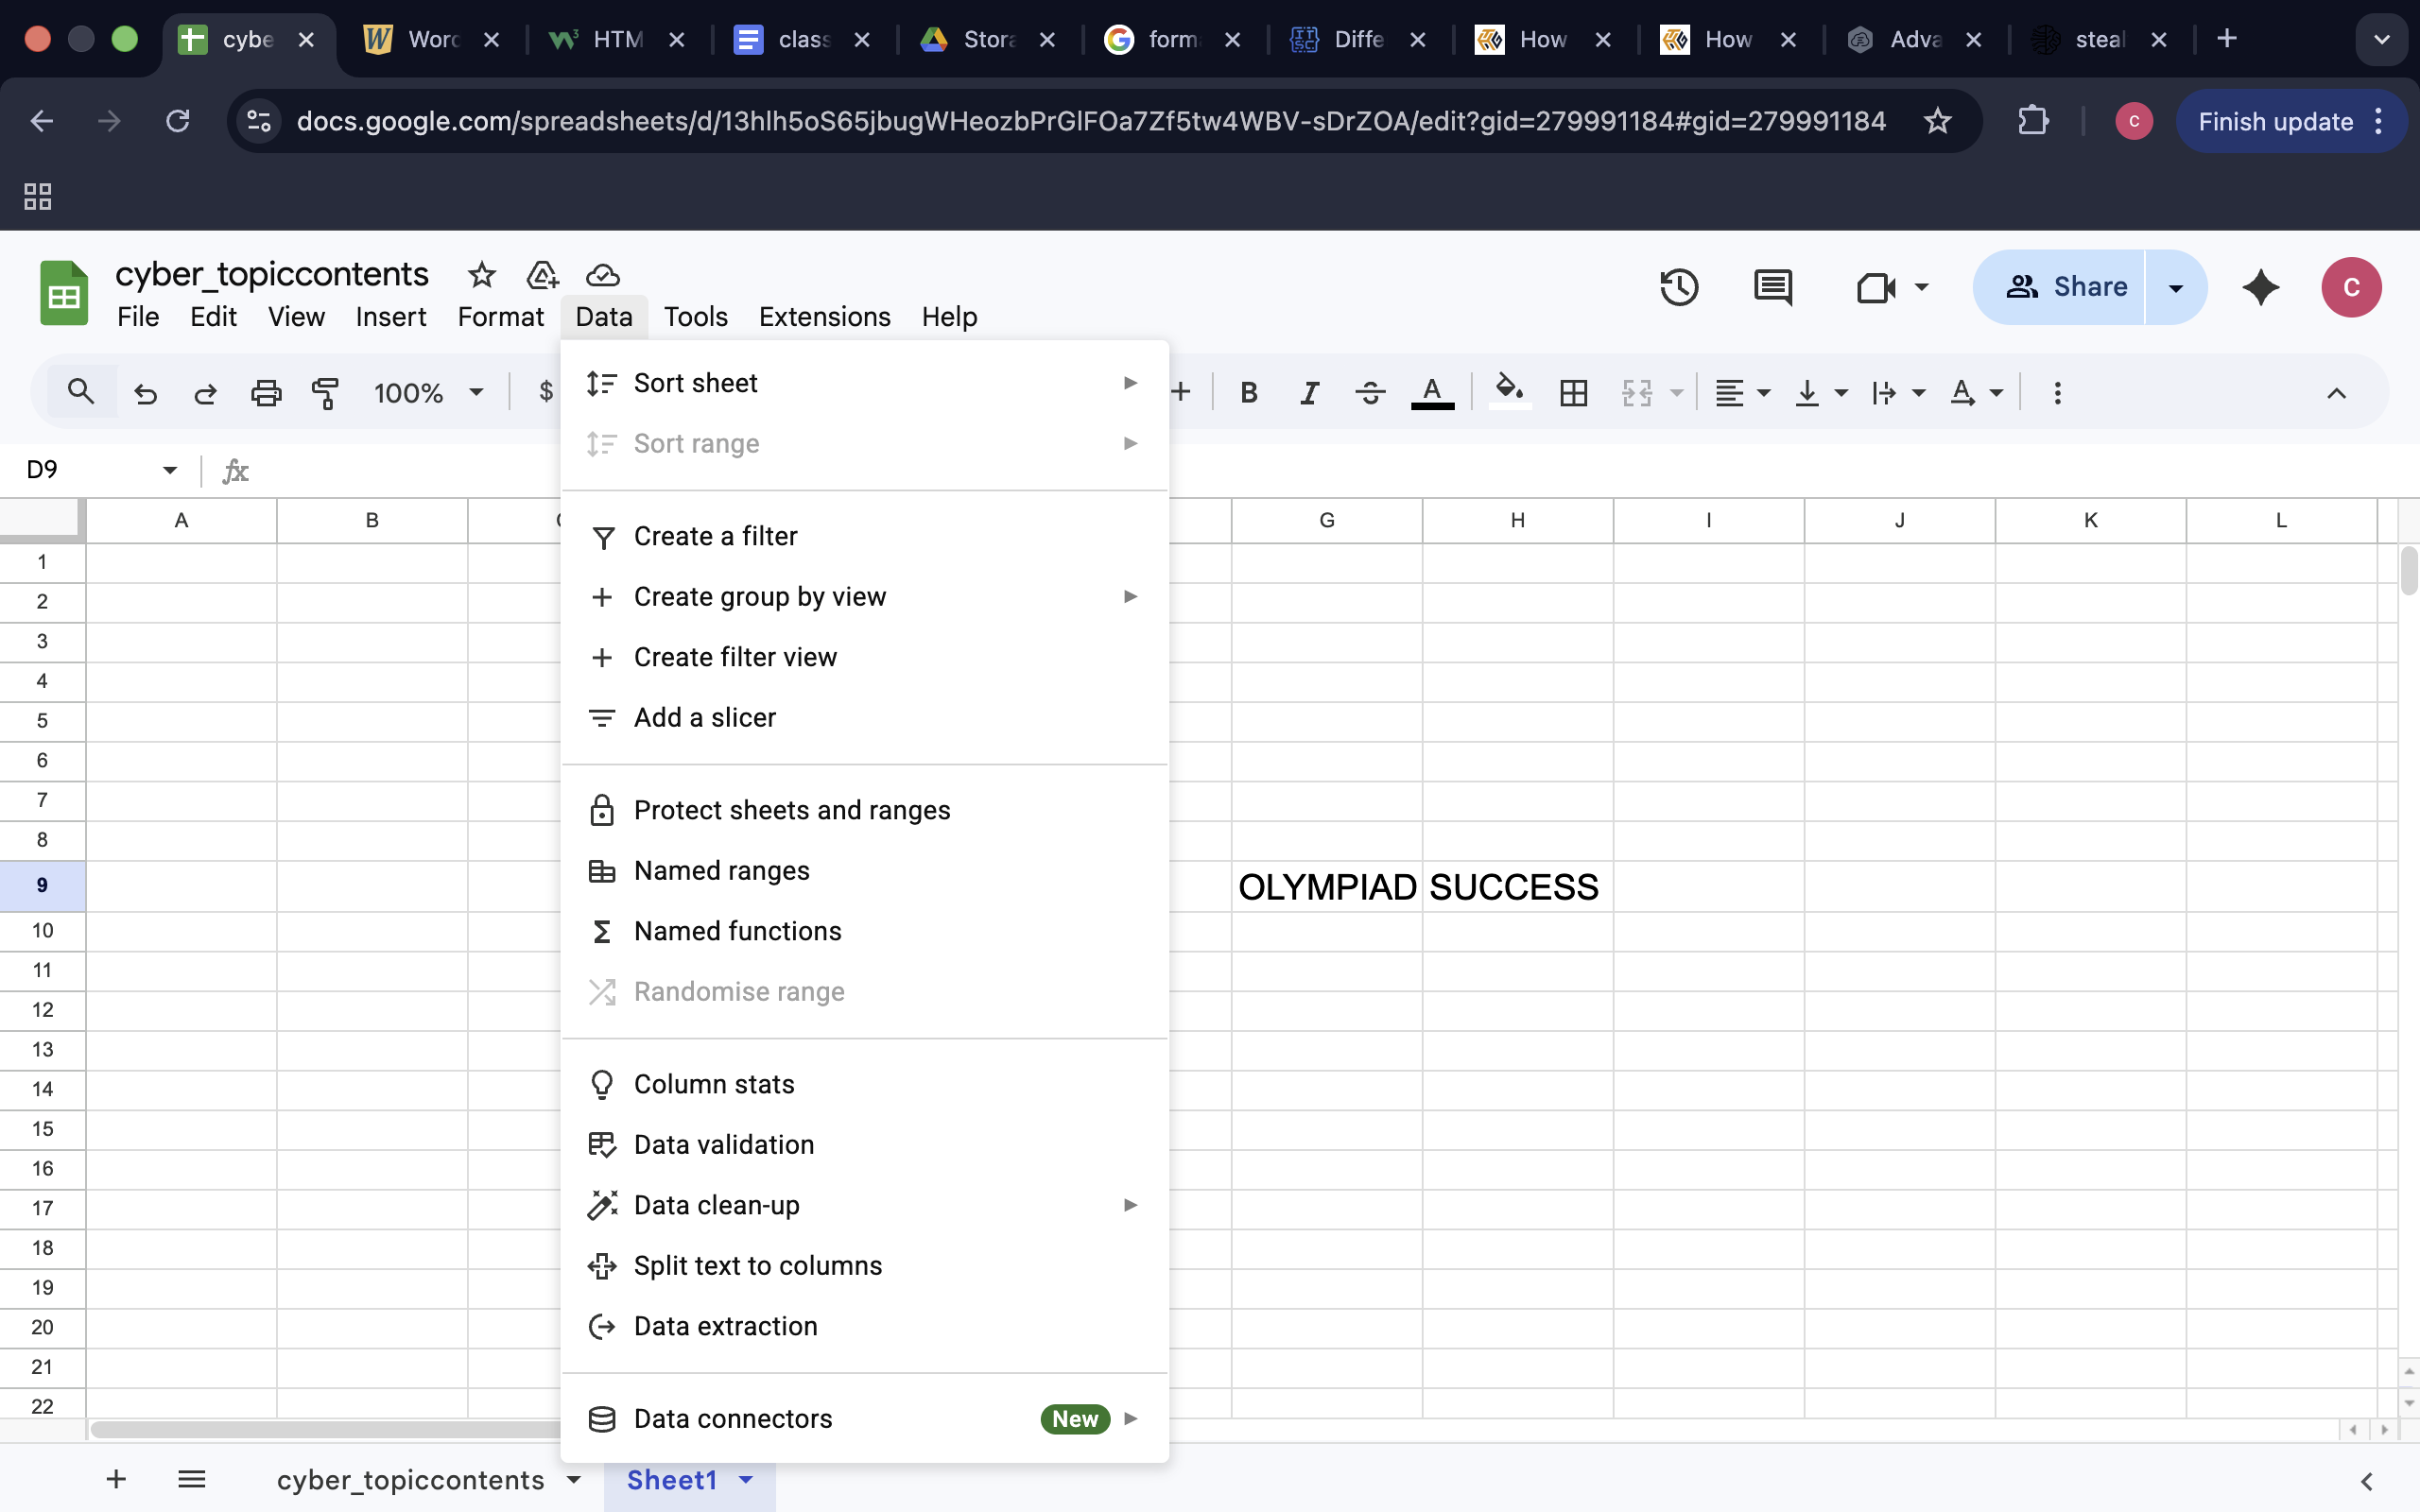
Sorting
Sorting is a process of putting data in a specific order.
Examples:
- Names in alphabetical order
- Marks from highest to lowest
- Sorting helps to compare and analyse the data easily.
Filtering
Filtering shows only some data based on a condition.
For example:
- Only display students who scored above 75
- Display one specific category
- Filtering is used to hide unwanted data without deleting it on a temporary basis.
- This makes analysis easier.
Insert Tab
The Insert tab is used by students to add graphical elements to make data more understandable.
Using the Insert tab, you can:
- Add charts (Column, Bar, Pie, etc.)
- Create tables
- Add pictures
- Insert shapes
- Add text boxes
Charts are useful for visualising the data so that numerical data can be converted into interpretive charts.
For example, a pie chart can be used to show the distribution of marks across subjects.
Visual representation of data makes data easy to interpret.
Page Layout Tab
The Page Layout tab controls the way the worksheet looks when printed.
It allows you to:
- Change page orientation (portrait or landscape).
- Adjust margins
- Set page size
- Add headers and footers
- Set print area
This is nice when you are turning in printed assignments.
Introduction to Macros
A macro means a recorded sequence of steps used to perform repeated tasks and is performed automatically.
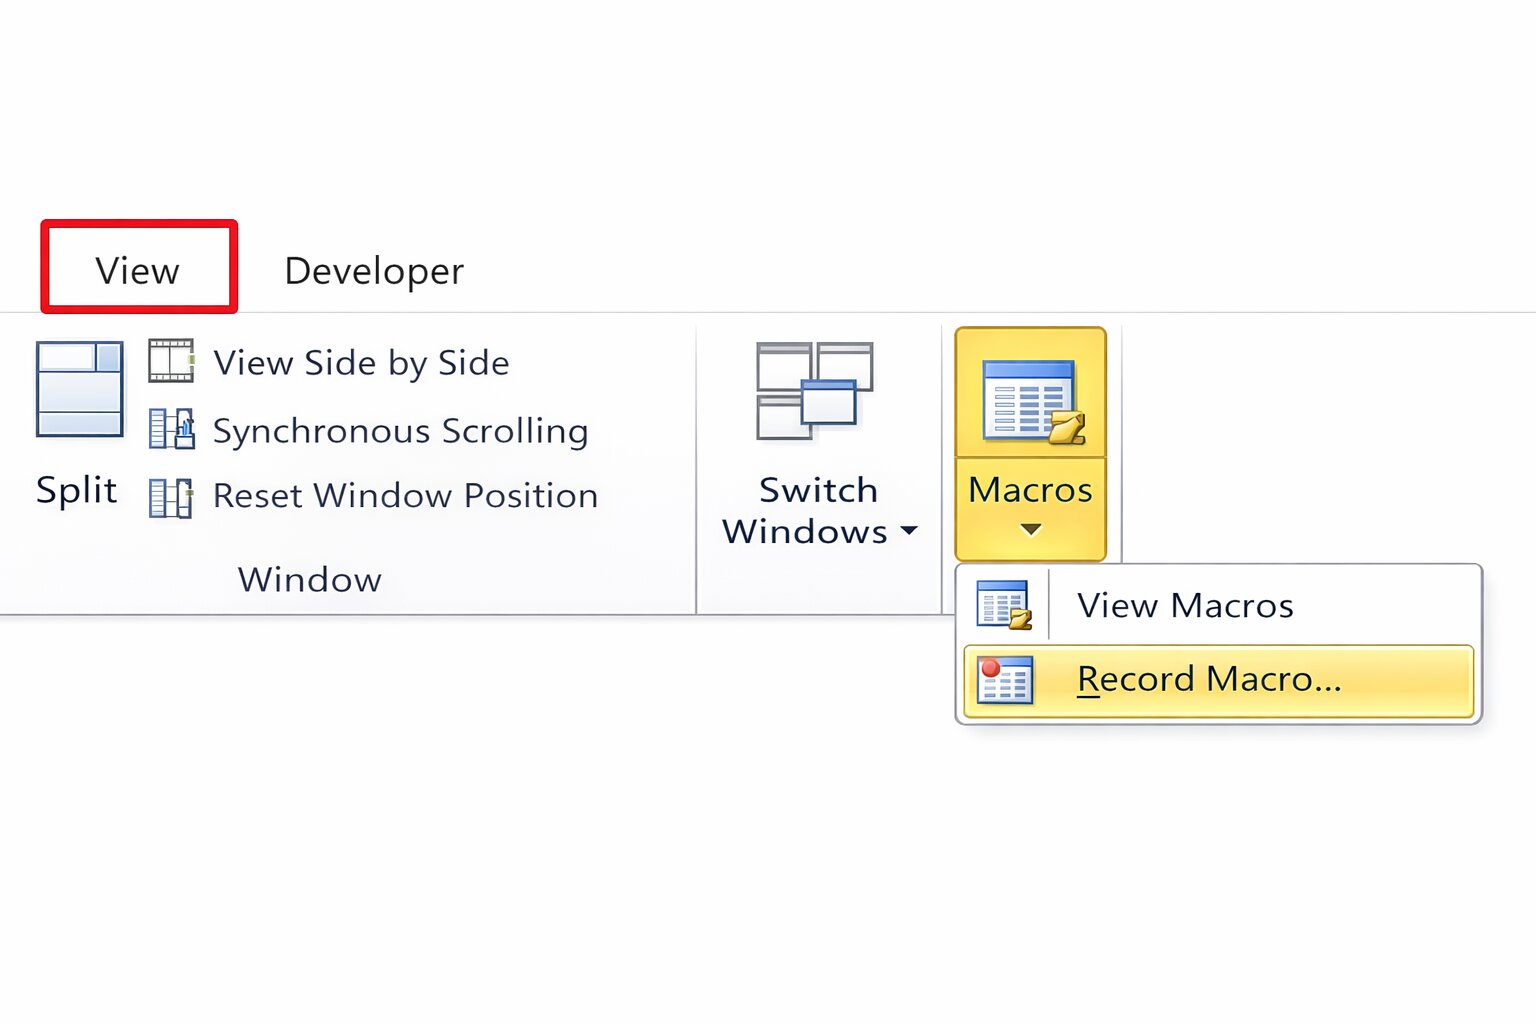
For example:
If you format data repeatedly with the same style, you can record the data formatting steps once.
After recording, one click is all that it takes to perform all the steps.
Macros help:
- Save time
- Increase efficiency
- Minimise repetitive manual work.
Although macros are slightly advanced, knowing the basic concept of macros helps develop the ability to think logically.
Why It is Important to Learn Excel
Excel develops:
- Logical thinking
- Numerical accuracy
- Data analysis skills
- Organisational ability
It prepares students for advanced computer topics in higher classes and practical use in real life.
QUIZ FOR MS EXCEL
1. A student records the 40 students marks in Excel. The marks are placed in small boxes created at the intersection of rows and columns. What is this box called?
A) Worksheet
B) Cell
C) Table
D) Formula
Answer: B) Cell
2. In Excel, a student will type '=A1+A2', and this will automatically calculate the total marks. What kind of Excel functionality is being used?
A) Chart
B) Sorting
C) Formula
D) Filter
Answer: C) Formula
3. A teacher is required to add all the marks of the students in cells A1-A5. Which formula should be used?
A) =MIN(A1:A5)
B) =AVERAGE(A1:A5)
C) =SUM(A1:A5)
D) =MAX(A1:A5)
Answer: C) =SUM(A1:A5)
4. A learner needs to be able to identify the minimum mark out of a list of marks stored in cells A1 to A10. What Excel operation will be useful?
A) SUM
B) MAX
C) MIN
D) AVERAGE
Answer: C) MIN
5. There are numerous student names on a worksheet. The teacher organises them in an A to Z way so that they are easy to find. Which Excel feature was used?
A) Filtering
B) Sorting
C) Formula Bar
D) Page Layout
Answer: B) Sorting
6. A teacher does not want to remove the rest of the records but just wishes to show students who scored more than 75 marks. What feature in Excel should be applied?
A) Sorting
B) Filtering
C) Charting
D) Formatting
Answer: B) Filtering
7. A student develops a pie chart to indicate the distribution of marks in subjects. On which tab of Excel is such a chart usually inserted?
A) Home
B) Insert
C) Data
D) View
Answer: B) Insert
8. Before a student prints, he or she desires to alter page orientation, margins and print area. What is the Excel sheet that manages these settings?
A) Home
B) Insert
C) Page Layout
D) Data
Answer: C) Page Layout
9. The student keeps on formatting worksheets in the same fashion. Which feature of Excel can be used to make all the steps of formatting in one click?
A) Macro
B) Chart
C) Filter
D) Worksheet
Answer: A) Macro
10. What is the address of the cell you are on displayed?
A) Formula Bar
B) Title Bar
C) Name Box
D) Ribbon
Answer: C) Name Box