MS Excel
Microsoft Excel is spreadsheet software that is applicable to the organisation, analysis, and management of data. It is very common in schools, businesses, research and finance. Students enrolled in Class 10 use advanced tools of Excel that assist in reporting, decision-making and analysing data.
Introduction to MS Excel
An Excel book is known as a workbook, and it has several worksheets. All the worksheets consist of rows and columns. A row and a column meet at a point that is referred to as a cell.
Excel is mainly used for:
Performing calculations
Analysing large data sets
Creating charts and reports
Managing records
Advanced Formulae and Functions
The calculations are more accurate and faster with the help of formulas and functions.
The following are some of the more frequently used advanced functions:
- IF – Examines a condition and either returns a result or does not.
- VLOOKUP / HLOOKUP - Tables search data.
- SUMIF / COUNTIF - Conditional calculations.
- PMT - Computes payment of loans.
- ROUND, POWER, SQRT - Mathematical functions.
These are effective in financial data analysis, financial records and result sheets.
Data Analysis Tools
Excel is a powerful tool that allows one to organise and analyse data.
Sorting and Filtering
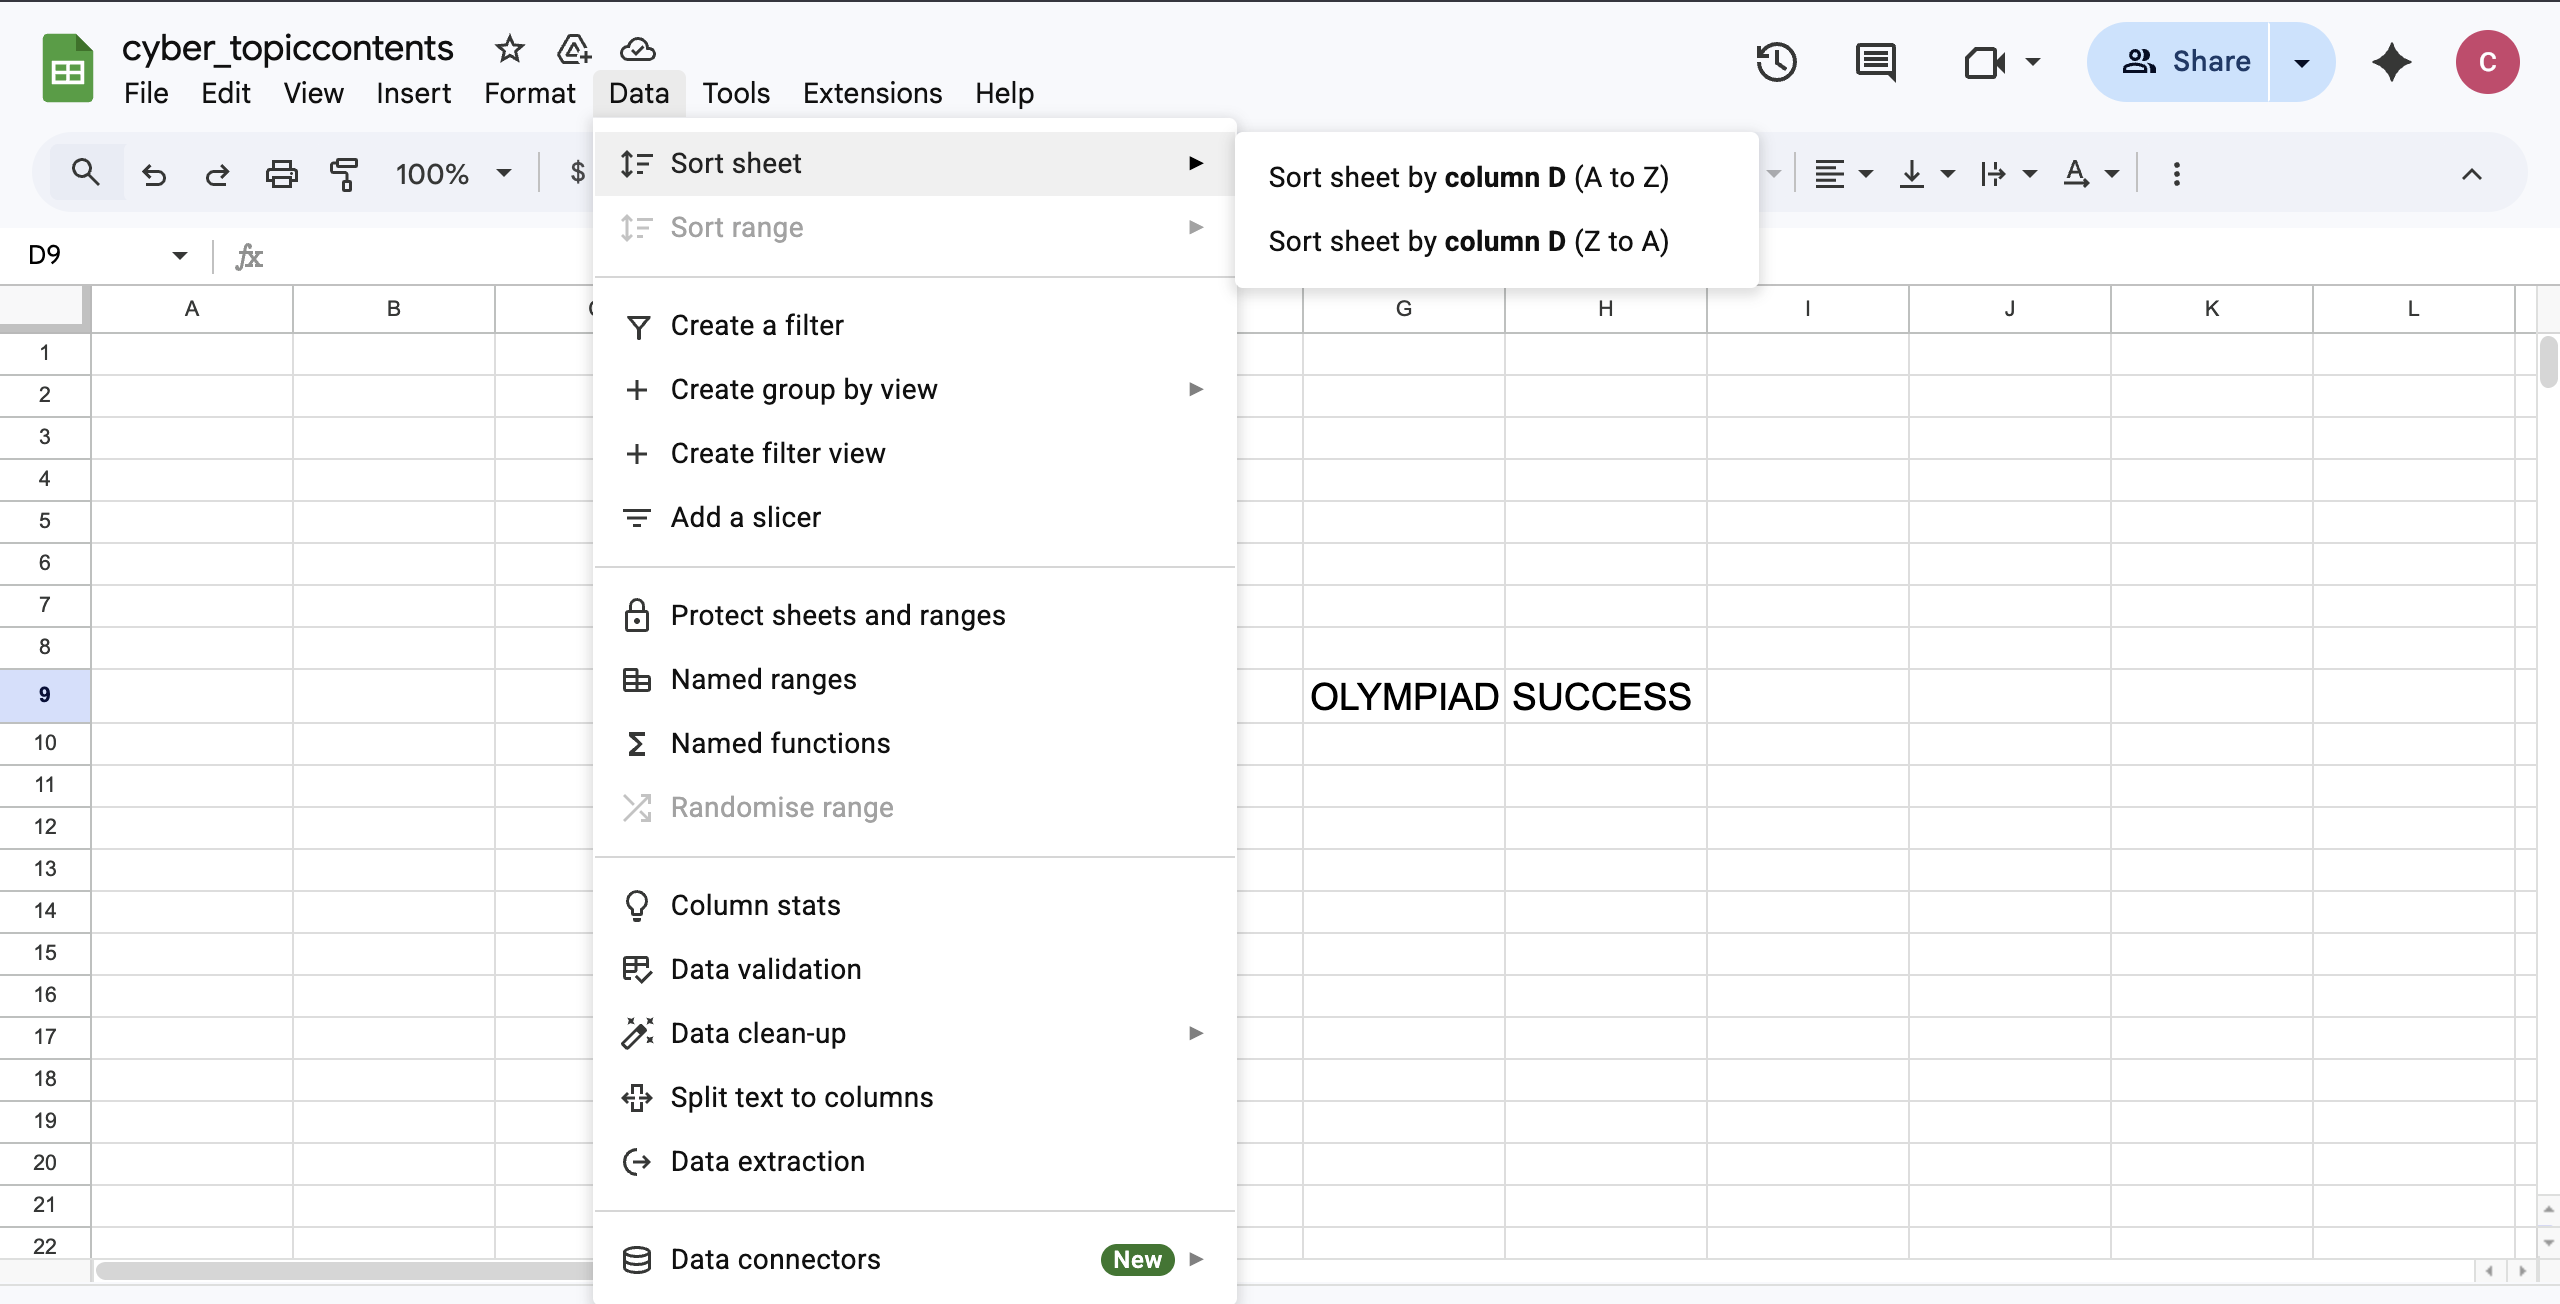
- Sort the information either upward or downward.
- Select certain records according to a condition.
- Find the information needed in massive datasets fast.
Data Validation
- Limit data entry to particular values.
- Create drop-down lists.
- Avoid wrong or undesirable entries.
Remove Duplicates
- Identify and remove duplicate records.
- Ensure quality and clean datasets.
Pivot Tables
- One of the best functions of Excel is pivot tables.
They help to:
- Have a lot of data to summarise.
- Generate reports instantly.
- Compare categories.
- Analyse trends and patterns.
Pivot tables find much application in business reporting and performance analysis.
Charts and Graphical Representation
When displayed in a graphical format, data is brought to a more comprehensible form. In Excel one is able to transform the data into graphics.
Common chart types include:
- Column Chart
- Bar Chart
- Pie Chart
- Line Chart
- Area Chart
Charts help in:
- Identifying trends
- Comparing values
- Reporting in a professional manner
- Supporting decision-making
The complex information is simplified through visual representation.
Safeguarding and Sharing Workbooks
Excel offers protection against data security.
Students learn to:
- Protect worksheet
- Protect workbook structure
- Lock specific cells
- Add password protection
In Excel, sharing of files can also be done.
Macros and Automation
Repetitive tasks can be automated by the use of macros.
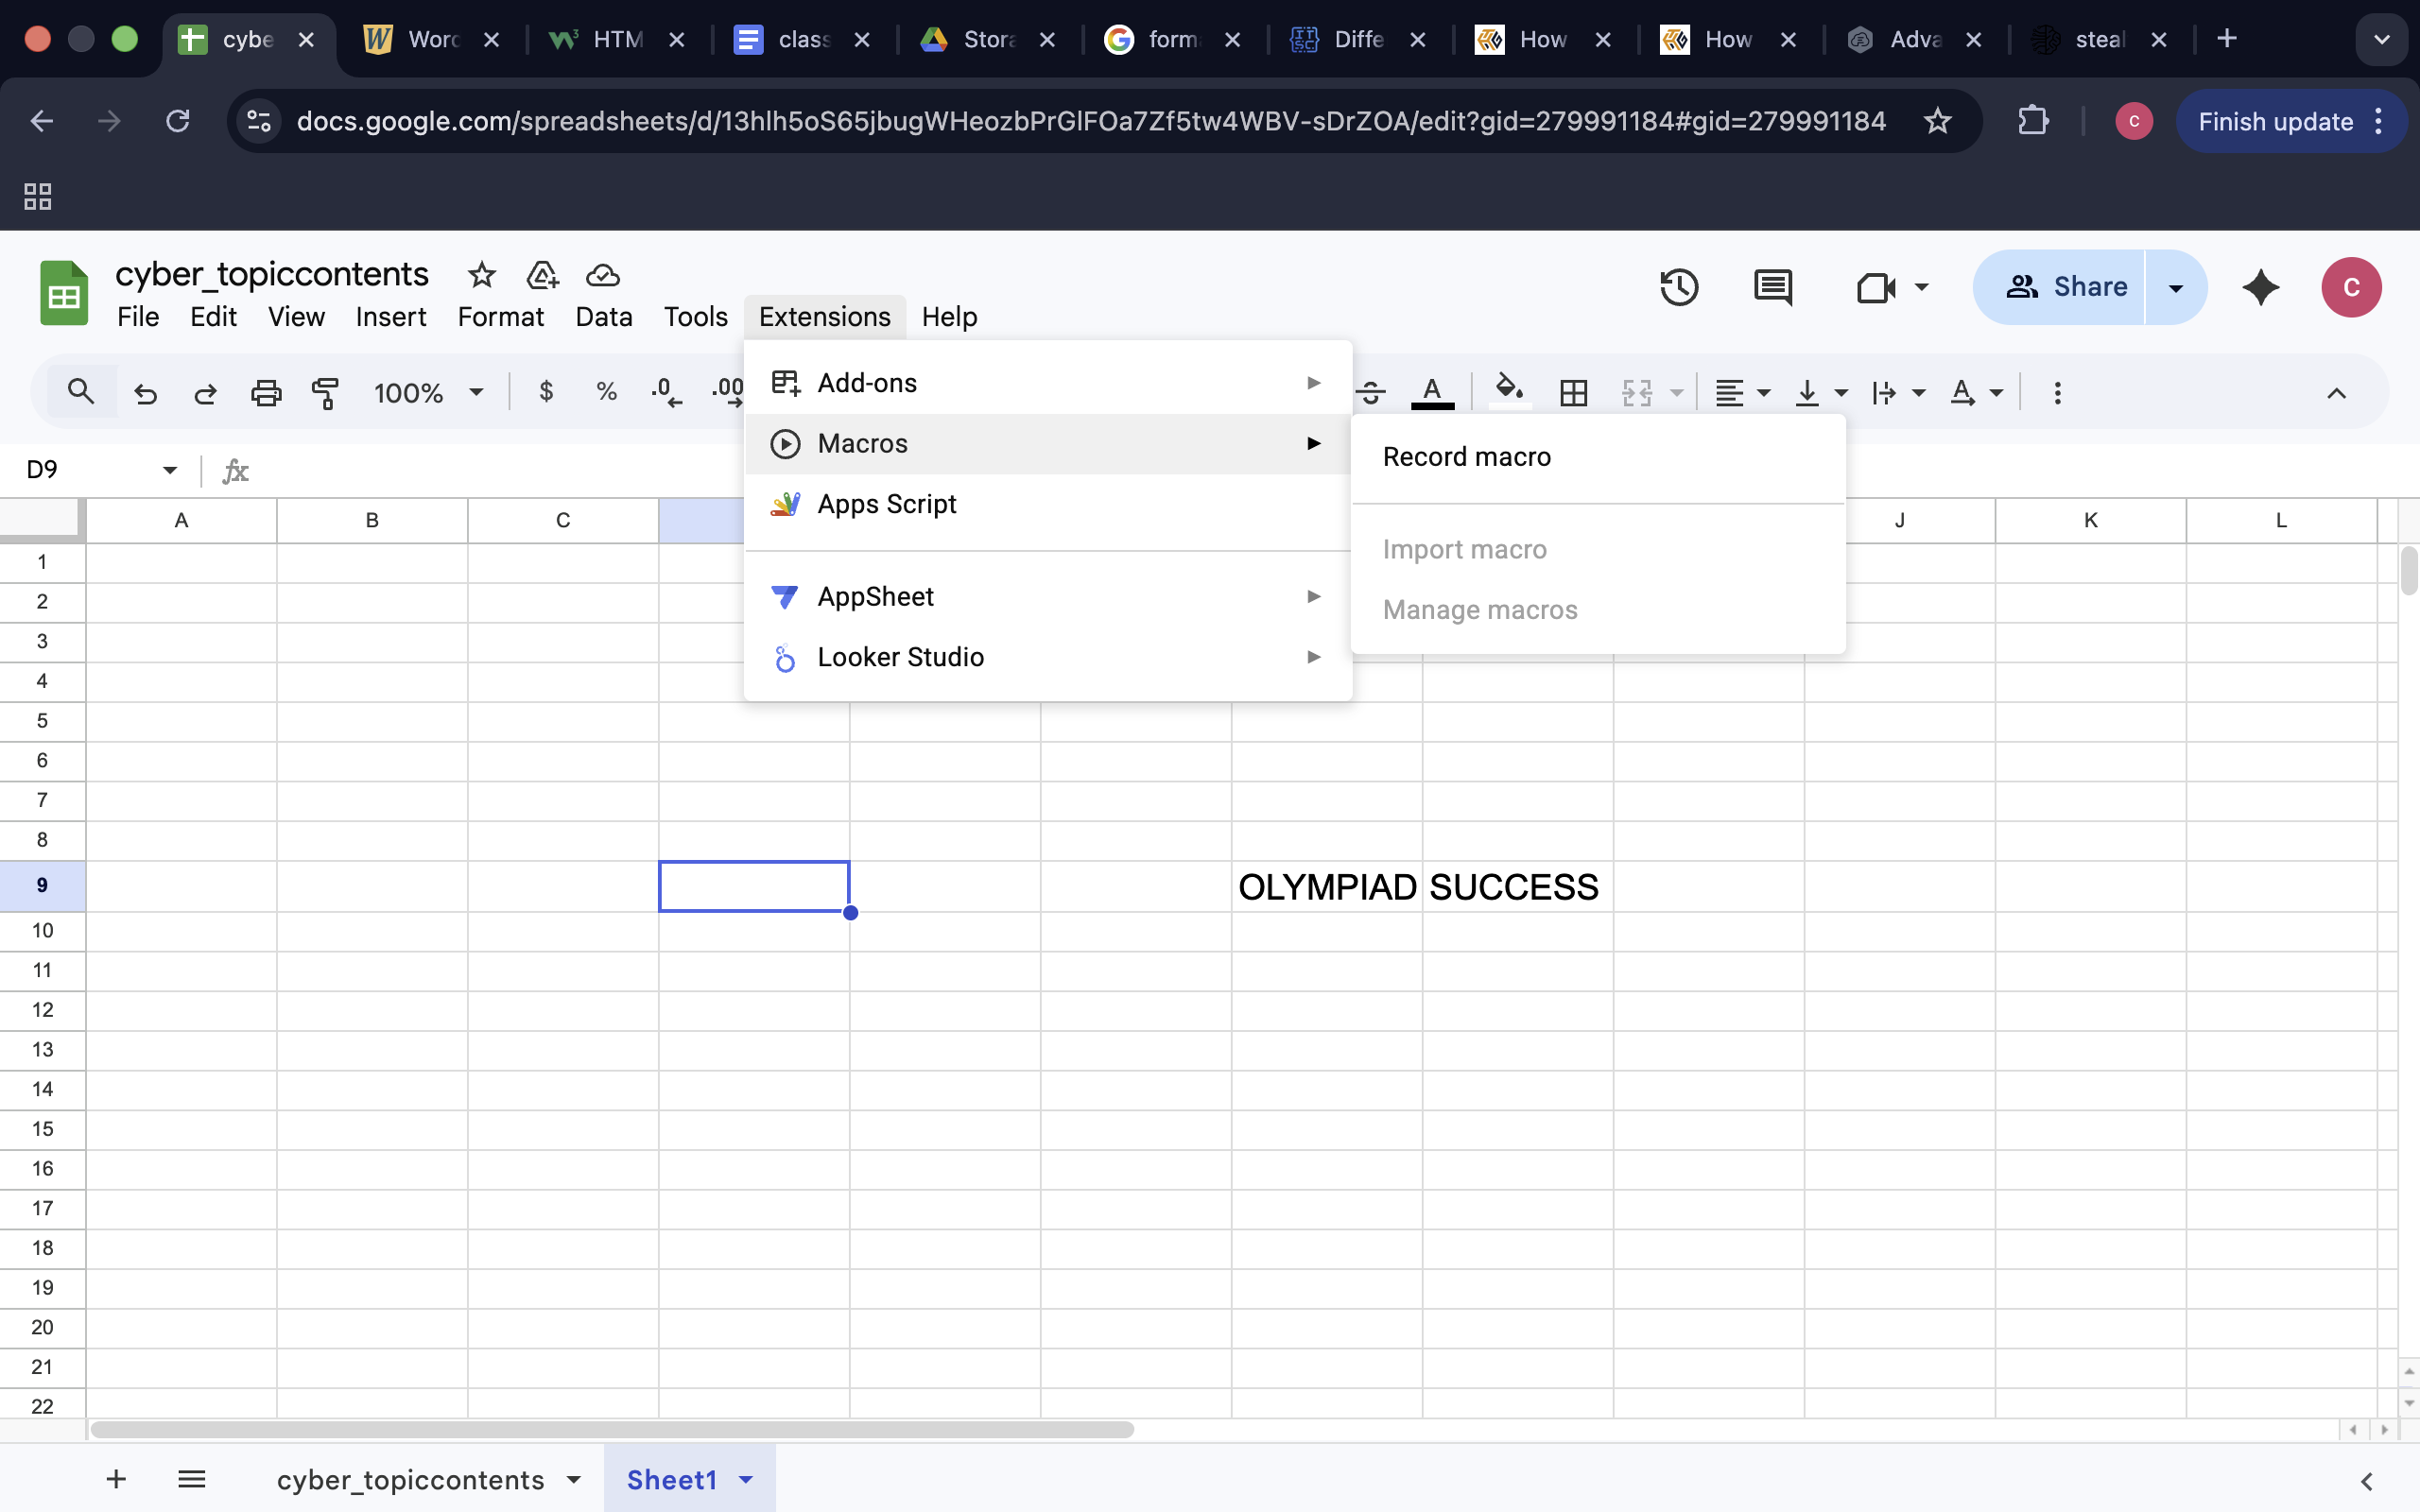
With macros, you can:
- Record repeated steps
- Save time
- Improve efficiency
Automation plays a significant role in the workplace.
MS Excel Practical Applications
MS Excel is used in:
- Accounting and finance
- Inventory management
- School result preparation
- Data analysis and reporting
- Business planning
It is regarded as one of the most significant means in the professional world.
QUIZ FOR MS EXCEL
1. A file that contains one or more worksheets is known as a _______ in MS Excel.
A) Spreadsheet
B) Workbook
C) Database
D) Table
Answer: B) Workbook
2. The junction of a column and a row in the Excel sheet is referred to as:
A) Range
B) Worksheet
C) Cell
D) Record
Answer: C) Cell
3. What Excel formula would be most appropriate to test whether a student has a mark above 40 and will give it a yes or no answer?
A) SUM
B) IF
C) COUNTIF
D) ROUND
Answer: B) IF
4. It is a user who needs to know the price of a product of a large table with the help of the product ID that is presented in the first column. Which is the most suitable function?
A) HLOOKUP
B) VLOOKUP
C) PMT
D) COUNTIF
Answer: B) VLOOKUP
5. One of the teachers wants to use excel to find out the number of students who scored above 90 marks in a lesson. What is the function to be employed?
A) SUM
B) COUNTIF
C) VLOOKUP
D) PMT
Answer: B) COUNTIF
6. What is the most significant feature of Excel that can be helpful when you have to summarise thousands of records and examine the patterns in a fast way?
A) Sorting
B) Data Validation
C) Pivot Table
D) Macros
Answer: C) Pivot Table
7. What would be the Excel tool that will limit the values that can be typed in by the user into a cell to a list of values that are predefined?
A) Sorting
B) Filtering
C) Data Validation
D) Conditional Formatting
Answer: C) Data Validation
8. In case a data set consists of multiple instances of one product, what is the Excel option that can somehow automatically identify and remove duplicate data?
A) Remove Duplicates
B) Filter
C) Sort
D) Consolidate
Answer: A) Remove Duplicates
9. One of the managers wants to demonstrate how the sales are distributed in percentages across various regions. What kind of chart would be most appropriate?
A) Line Chart
B) Column Chart
C) Pie Chart
D) Area Chart
Answer: C) Pie Chart
10. In Excel, it is referred to as recording a series of steps that can be repeated in the future.
A) Pivoting
B) Macro
C) Sorting
D) Validation
Answer: B) Macro